Canada: Gas Price Research Analysis from 1990 – 2024
A 34-year deep dive into Canadian gas price trends — examining provincial variation, year-over-year changes, and the seasonal forces that move the pump price every summer.
Overview
Gas prices affect every Canadian — from commuters to trucking companies to provincial governments setting fuel tax policy. Yet most reporting focuses on the current price at the pump, rarely contextualising it against long-term trends.
This research project uses monthly self-service filling station data from Statistics Canada to trace price movements across all provinces from 1990 to 2024, surfacing the structural trends and anomalies that define Canada's fuel pricing history.
The Data
Monthly average gas price data was sourced from Statistics Canada's open dataset covering self-service stations. The dataset was cleaned, structured in MySQL, and enriched with provincial metadata before analysis.
Years of Data
Monthly records from 1990 to 2024, providing a full generational view of Canadian fuel pricing.
Provinces & Territories
Coverage across all Canadian provinces and select territories, enabling direct regional comparisons.
Data Source
Official government monthly price survey data — the most authoritative source available for long-run price analysis.
Key Findings
- Long-run Price Acceleration: Average national gas prices rose over 300% between 1990 and 2022, with the steepest increases clustered around the 2008 global oil shock and the 2021–2022 post-pandemic supply crunch.
- Provincial Spread: BC and Ontario consistently recorded the highest average prices, driven by higher provincial fuel taxes and carbon levies. Prairie provinces (Alberta, Saskatchewan) sat notably below the national average due to lower tax regimes and proximity to oil production.
- Seasonal Patterns: A reliable summer premium emerged in the data — prices consistently peaked in June–July and troughed in January–February, driven by refinery switchovers and driving season demand.
- Year-over-Year Volatility: 2008 and 2022 recorded the largest single-year price spikes (>30% YoY), while 2015 and 2020 saw the sharpest drops tied to global oil oversupply and demand collapse during COVID-19.
Methodology
Data Extraction & Storage
Raw CSV data from Statistics Canada was imported into a MySQL database. Provincial codes were normalised and duplicate entries were removed.
Python Analysis
Pandas was used to compute rolling averages, year-over-year change rates, and seasonal decomposition. Outlier years were flagged for contextual annotation.
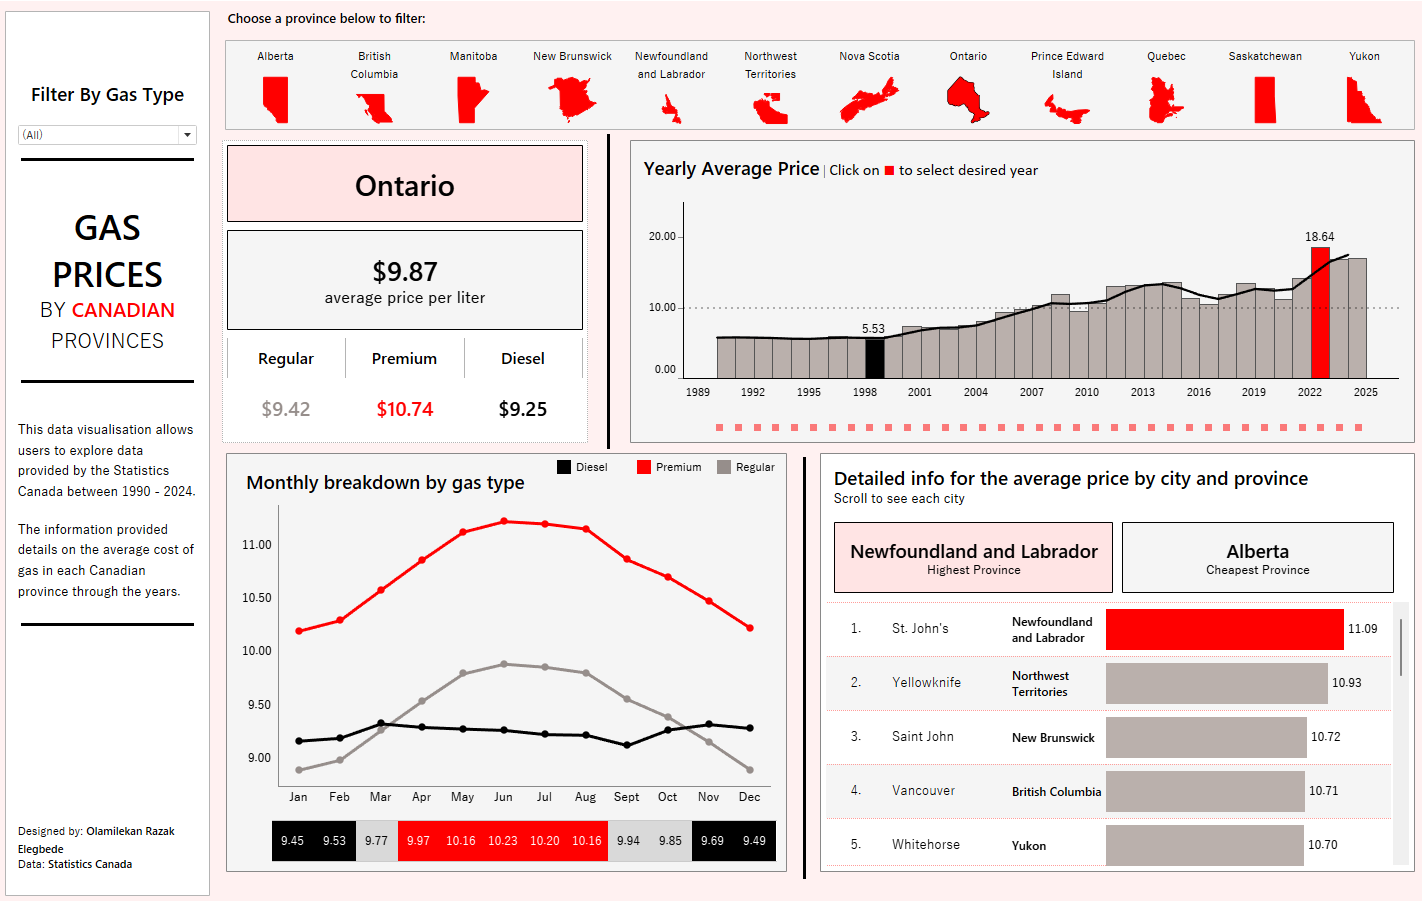
Tableau Dashboard
An interactive Tableau dashboard was built to let users explore prices by province, year range, and metric — combining a map view with trend lines and YoY comparison charts.
Explore the Project
Explore the interactive dashboard or browse the full code on GitHub.