Bumpy Chart — Week-by-Week League Table
A Bundesliga season visualised as a bumpy chart — tracking every team's position week by week to reveal momentum swings, title races, and relegation battles hidden in a static end-of-season table.
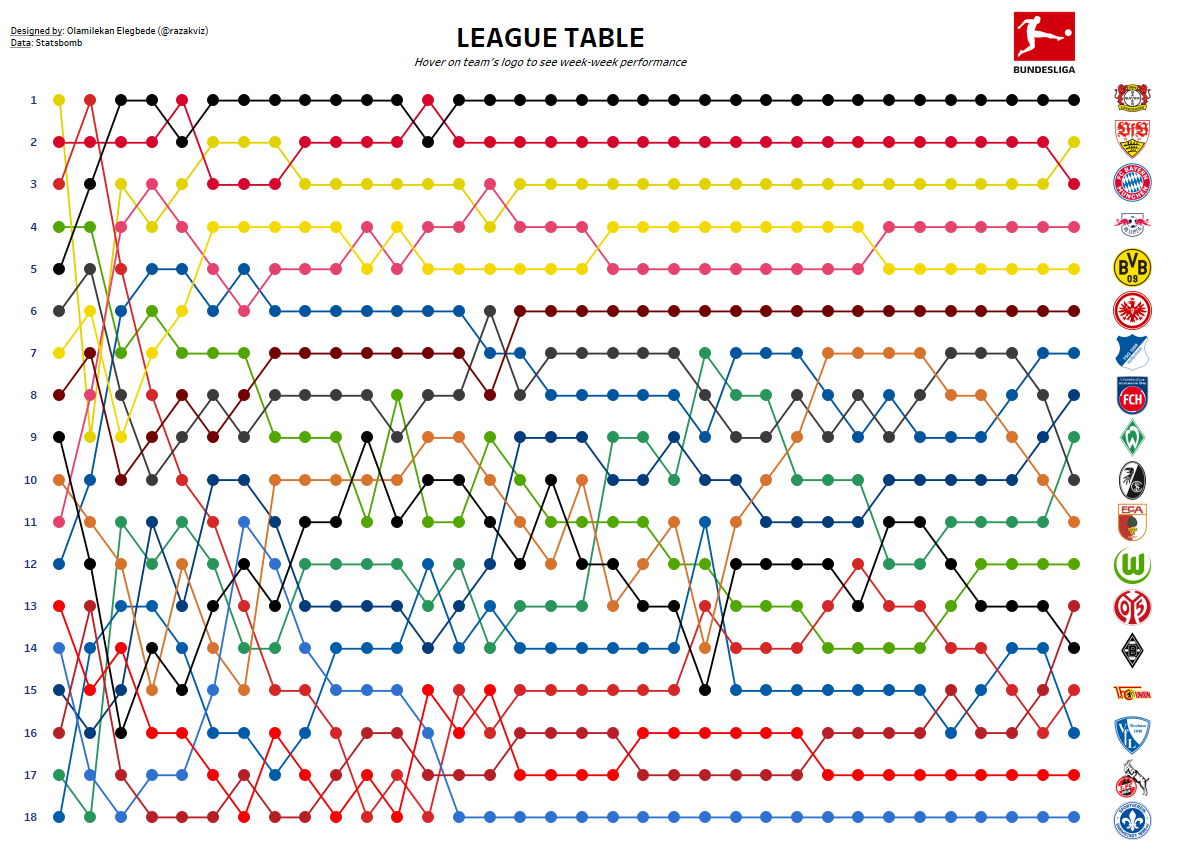
Overview
A standard end-of-season league table tells you where each team finished, but it hides everything that happened in between. A bumpy chart solves that — plotting every team's position after each gameweek and connecting them with lines, producing a visual narrative of the entire season's drama.
This project charts a full Bundesliga season week by week, making it instantly clear when title races tightened, when relegation battles escalated, and which teams maintained consistency versus those that went on remarkable runs or collapses.
What the Chart Reveals
- Form Trajectories: Teams that climbed steadily through the season are immediately distinguishable from those that surged early and faded — or those that produced a late-season run to safety or European qualification.
- Title Race Narrative: The gap between the top two or three teams across the weeks tells the story of how competitive the title race was — whether it was decided early or went to the final day.
- Relegation Drama: Crossings and overtakes in the bottom three positions are visually compelling — showing which clubs fought their way out of the drop zone and which couldn't hold their position.
Technical Implementation
Data Collection
Bundesliga weekly standings data was collected and structured in Python, creating a gameweek-by-position matrix for all 18 clubs across the full season.
Python Processing
Pandas was used to reshape the data into a long format suitable for line chart rendering — with each row representing one team's position at one gameweek.
Tableau Visualisation
A Tableau bumpy chart was built with team-coloured lines, an inverted y-axis (position 1 at top), and interactive highlighting to focus on individual teams or groups (top 4, bottom 3).
Explore the Project
Interact with the full Tableau dashboard or browse the code on GitHub.