Marketing and Customer Insights Analysis
Uncovering critical sales, marketing, and customer insights for an e-commerce electronics company — across 310 products, 10 business lines — to sharpen marketing strategy and drive revenue growth.
Overview
OxiN is an e-commerce company selling popular electronic products across 10 business lines. With 310 products in the catalogue and a significant marketing budget, the company needed a clearer picture of what was driving revenue, which marketing channels were earning their spend, and how customer behaviour varied across segments.
This project delivers a comprehensive analysis of sales, marketing expenditures, customer insights, and product performance — culminating in an executive-ready Tableau dashboard and a set of data-driven recommendations.
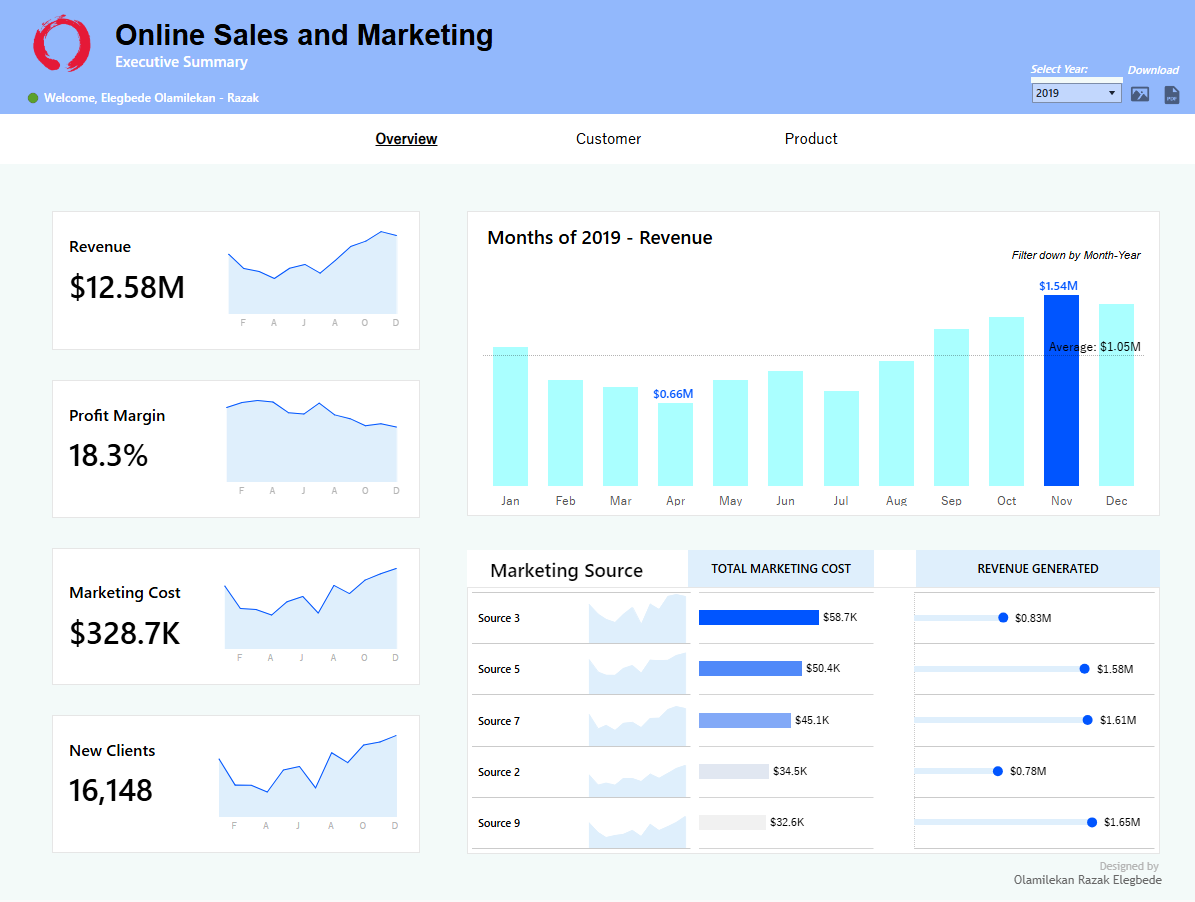
Key Findings
- Top Revenue Drivers: A small subset of product lines generated the majority of revenue, highlighting a classic long-tail distribution where targeted investment in top performers offers the highest return.
- Marketing ROI Disparity: Significant variation was found in marketing spend efficiency across channels — some channels delivered 3x the customer acquisition rate of others at comparable spend levels.
- Customer Segmentation: Customer purchase behaviour clustered into distinct segments by order value, frequency, and product category preference — enabling more targeted re-engagement and upsell strategies.
- Seasonal Sales Patterns: Clear Q4 peaks (driven by holiday shopping) and mid-year troughs provided a basis for more strategic inventory and campaign planning across the year.
Methodology
SQL Data Extraction
Sales, marketing, and customer data were queried from a relational database. Joins across order, product, and customer tables created a unified analytical dataset.
Customer & Product Analysis
Revenue attribution, average order value, repeat purchase rates, and channel-level ROI were computed. Product rankings and business-line performance were compared across time periods.
Executive Dashboard
A Tableau executive summary dashboard was built combining KPI scorecards, trend lines, product performance matrices, and customer segment breakdowns — designed for stakeholder review without requiring data expertise.
Explore the Project
View the executive dashboard or read the full technical write-up on GitHub.