Ottawa Auto Theft Analysis 2018 – 2023
Car theft rates in Ottawa rose by 124.4% over five years. This report analyses 7,826 vehicle thefts — uncovering temporal patterns, high-risk neighbourhoods, recovery rates, and the most targeted vehicle manufacturers.
Executive Summary
In Ottawa, an average of four vehicles are stolen every day. After the historically high auto theft trends in 2022, the data in this report illustrates the National Auto Theft Crisis. Auto theft data represents vehicle styles such as cars, SUVs, trucks, motorcycles, vans, trailers, ATVs, snowmobiles, and motor homes.
In 2023, the Ottawa Police Service reported over 1,994 stolen vehicles, amounting to approximately $26.6 million in loss value, with a recovery rate of 57%. Barrhaven and Orleans neighbourhoods remain hotspots for auto thefts across the city, with the highest number of auto thefts and the lowest recovery rates.
The top priorities to make a meaningful impact on the auto theft crisis in Ottawa are:
- Preventing vehicles from being stolen in the first place through effective anti-theft measures by manufacturers.
- Placing a strong emphasis on information sharing and data-driven partnerships.
By understanding why auto theft trends are happening, organisations and decision-makers dedicated to preventing auto theft can effectively collaborate to create solutions. This report aims to provide key stakeholders with the information and insights to support a collective and collaborative approach to ending auto theft in Ottawa.
Temporal Analysis
Auto theft in Ottawa has shown fluctuating trends over the years, with a slight decline in 2023 following a record-high year in 2022. Despite this, theft rates have surged dramatically since 2018, emphasising the need for targeted prevention strategies based on peak times and daily patterns.
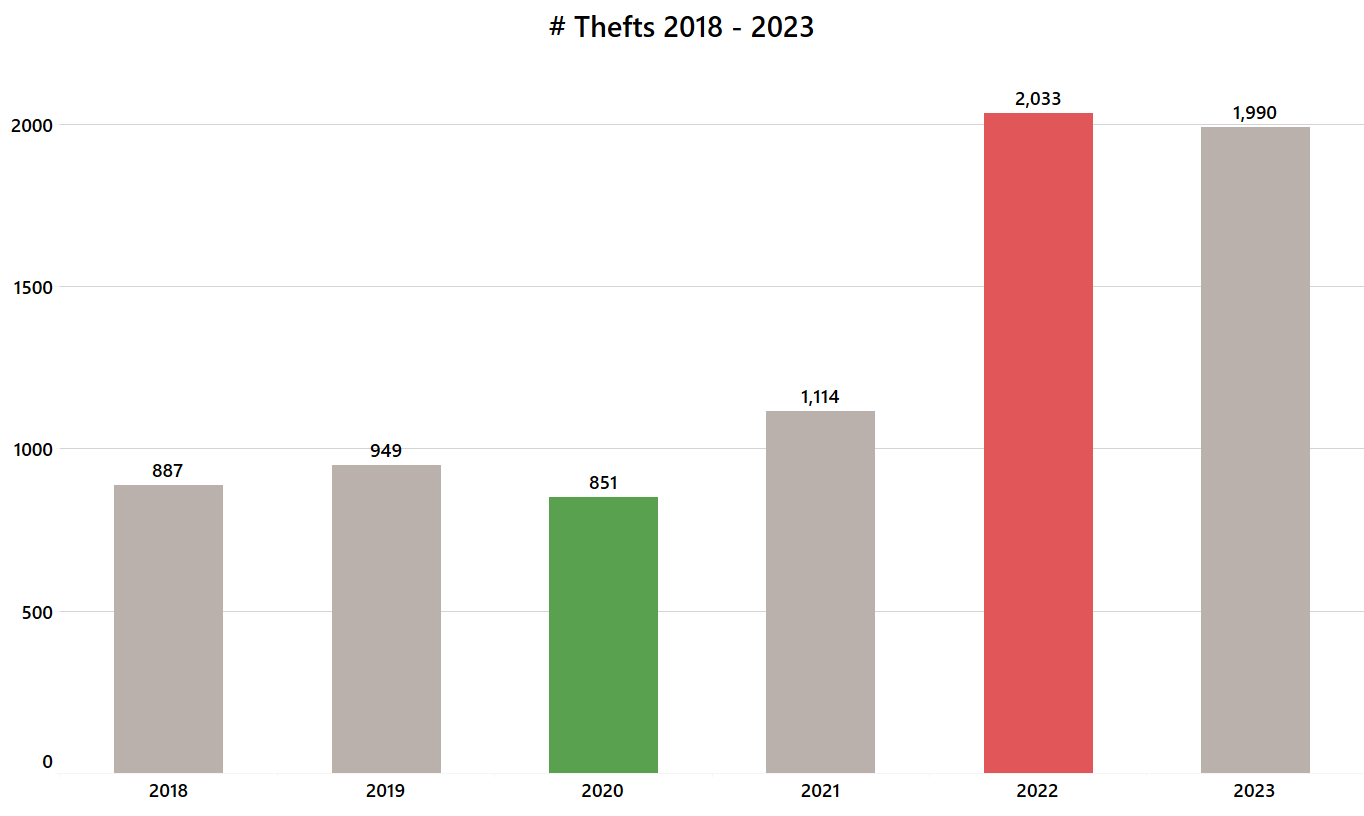
- Following a historically high year in 2022 with 2,033 recorded thefts, auto theft in Ottawa experienced a slight year-over-year (YoY) decrease of –2.1% in 2023. However, overall trends show a significant increase of +123.8% in thefts between 2018–2023.
- Thefts showed a continuous upward trend throughout the year, with rates peaking in October and November at about 5 thefts per day. While there was a noticeable dip in monthly rates at the start of the year, the data does not indicate strong seasonality.
- Weekends accounted for 26.3% of thefts, suggesting that thefts are more likely to occur on weekdays, possibly due to less vigilance during regular work or commute times.
- Over 58% of thefts occur in the evenings and nighttime hours (8 PM – 3 AM), with a significant 40% during the evenings — highlighting the significance of implementing additional home surveillance features during these high-risk periods to deter thefts.
Geographical Analysis
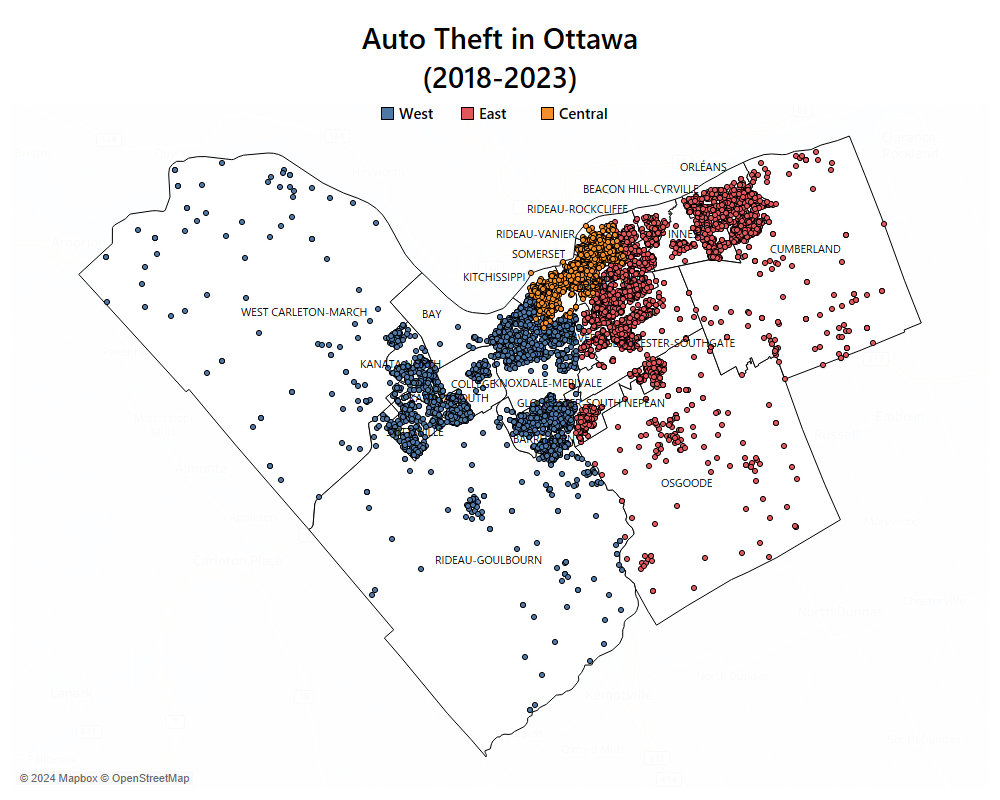
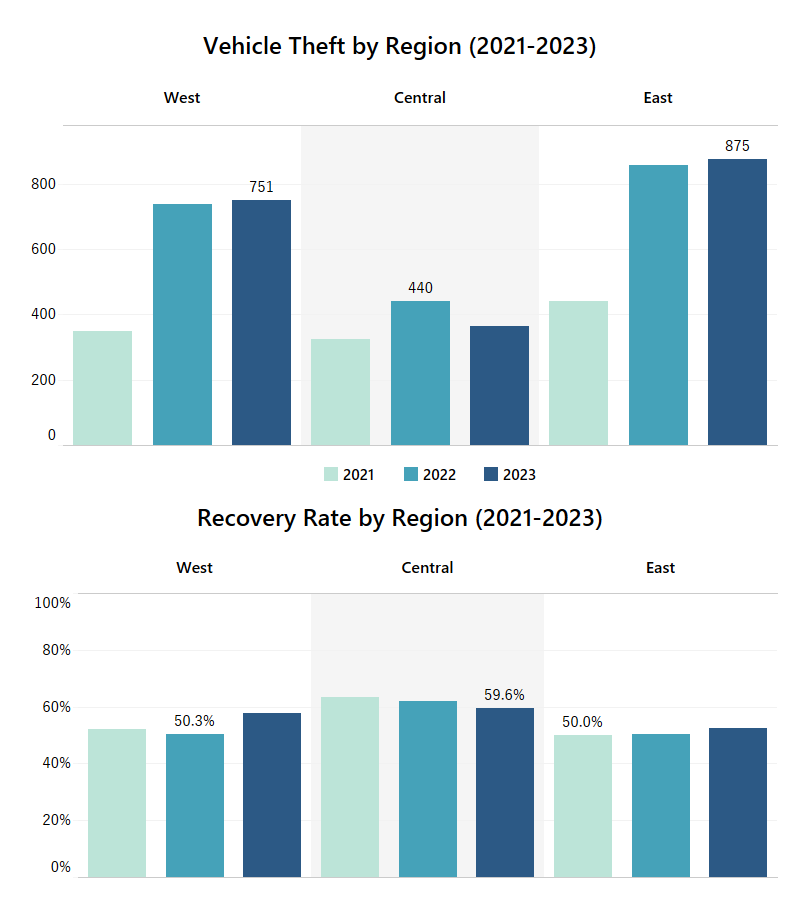
High-risk neighbourhoods and residential areas, particularly in the East and West, have emerged as hotspots, highlighting distinct geographical patterns in theft activity.
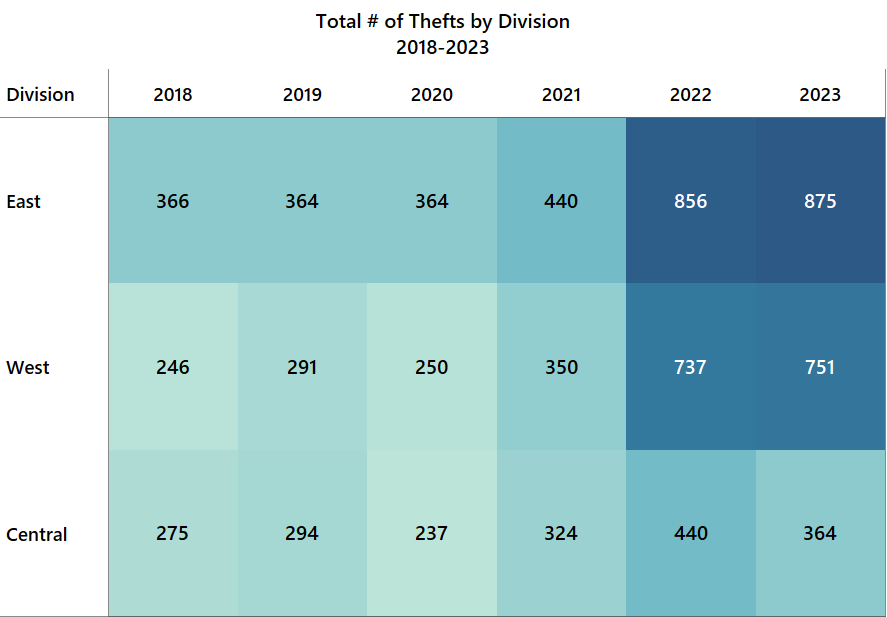
- Auto theft across Ottawa from 2018–2023 has increased significantly: +205.7% in the West, +139.2% in the East, and +30.9% in Central Ottawa.
- East Ottawa consistently reported the highest number of thefts, accounting for over 41% of thefts during this period — likely influenced by its proximity to the Port of Montreal, a key export hub for stolen vehicles.
- The neighbourhoods of Barrhaven, Orleans, and Centretown were the highest-risk areas, with a total combined loss of approximately $17.7 million.
- High theft density correlates with residential areas, particularly in densely populated neighbourhoods in the West and East, compared to Central Ottawa where commercial activity is more prevalent.
.png)
Vehicle Attributes
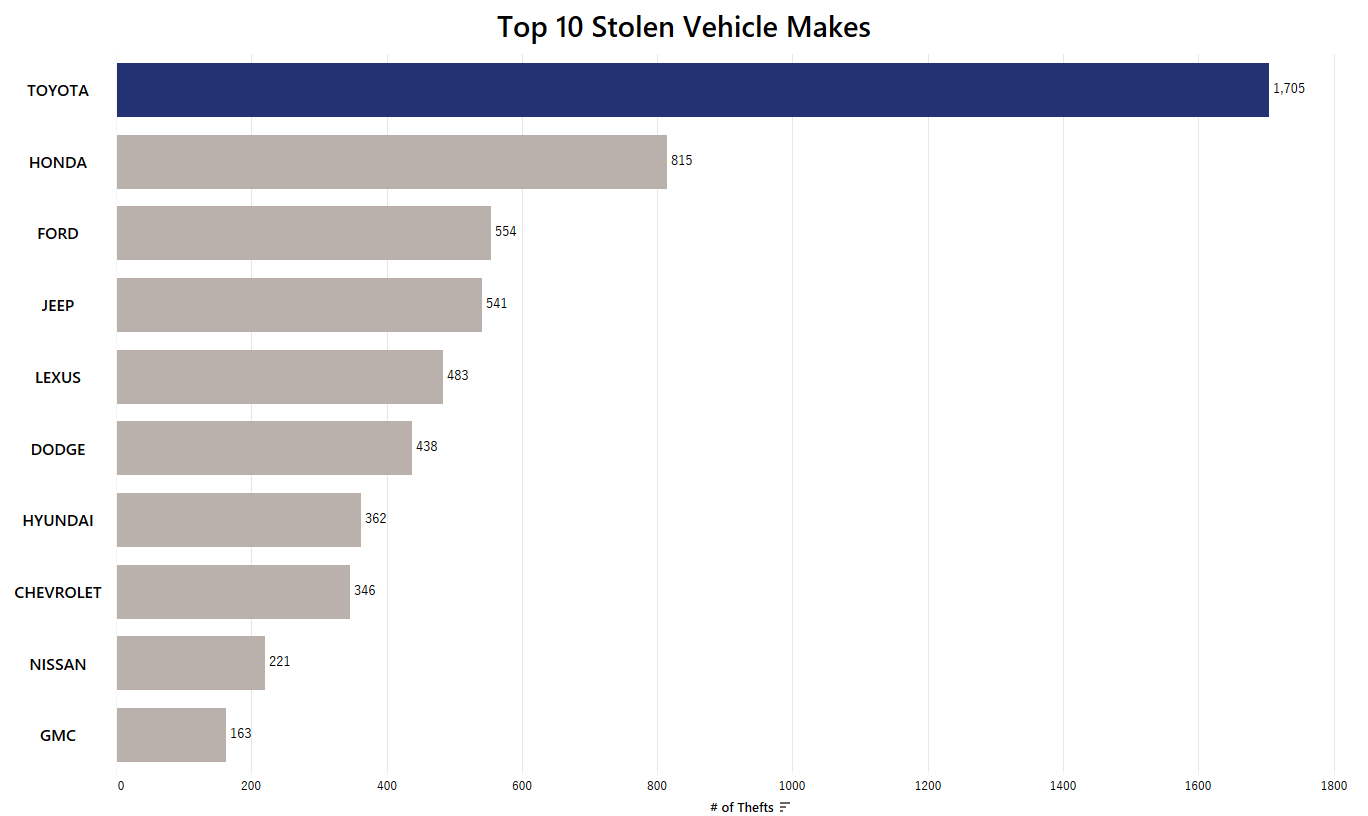
- Toyota vehicles accounted for 21.8% of auto thefts, with the 2018, 2019, 2021 and 2022 Highlander SUV models being the most targeted — primarily attributed to their demand in international markets and weaker security features.
- The majority of vehicle thefts (52.9%) in Ottawa involved vehicles made in 2017 or newer ($76.7 million in loss value), as organised crime rings focus on stealing new and luxury vehicles for maximum profit through overseas sales.
- This is further illustrated by the recovery rate of 50.9% for newer models, suggesting many are being exported overseas through the Ports for resale.
- Automobiles (sedans, coupes, and hatchbacks) were the most stolen vehicle type, accounting for 58.7% of thefts.
- Other frequently stolen brands include Honda, Ford, Jeep, and Lexus, collectively representing a loss value of $36.6 million.
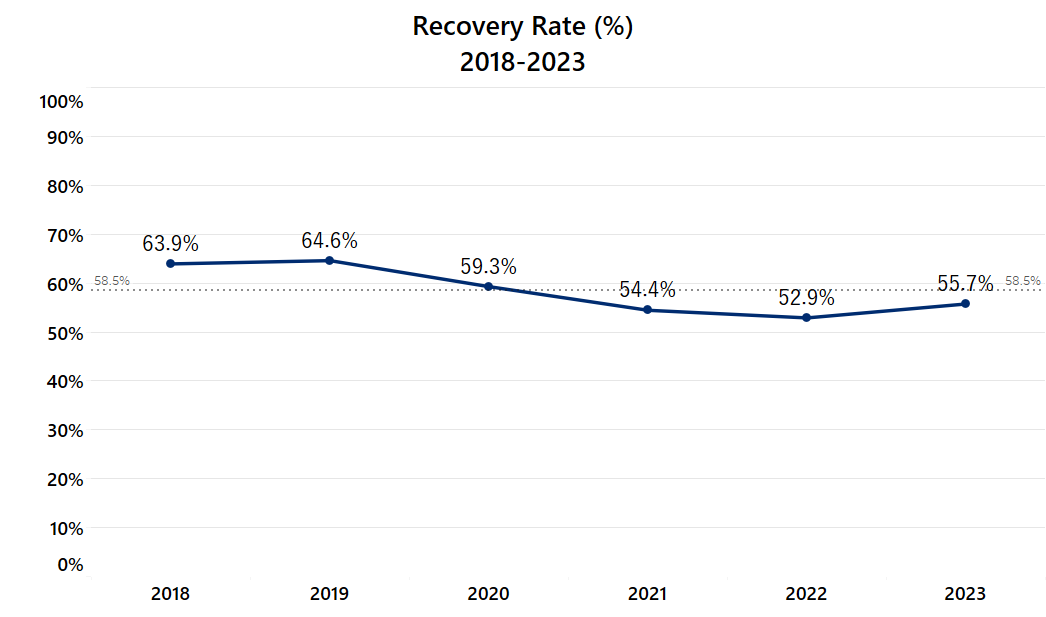
Recovery Rates
Between 2018 and 2023, there were 7,826 recorded vehicle thefts in Ottawa, with only 57.2% of vehicles being recovered. Recovery trends have declined over time, dropping from 63.9% in 2018 to 55.7% in 2023, despite a 2.9% year-over-year increase from 2022.
- Hyundai vehicles had the highest recovery rate (83.1%) among cars with at least 200 reported thefts — likely indicating lower demand on the black market, with an average stolen value of approximately $3,131. This suggests these cars were primarily stolen to commit other crimes rather than for resale.
- Lexus vehicles had the lowest recovery rate (40.2%) among cars with at least 200 reported thefts, with only 179 recovered from 483 stolen. The average value of these stolen vehicles was approximately $13,170 — suggesting most were exported overseas by organised criminal groups.
- Vehicles manufactured in 2017 or newer had a significantly lower recovery rate (51.4%) compared to those manufactured before 2017 (71.9%), for models with at least 100 reported thefts.
- The disparity in recovery rates could stem from theft techniques, resale demand, and tracking capabilities. Toyota and Lexus, despite being popular targets, have notably lower recovery rates — underscoring the need for enhanced security measures for these brands.
Solutions and Recommendations
- Enhanced Security for High-Risk Areas: Increase police and security presence in high-risk neighbourhoods, particularly in the East, during peak theft periods at night (8 PM – 3 AM).
- Improved Vehicle Anti-Theft and Tracking Features: Collaborate with automakers — particularly Toyota, Honda, Ford, Jeep, and Lexus — to improve anti-theft systems, address vulnerabilities exploited by criminal groups, and enhance car tracking systems to improve recovery rates.
- Community Awareness and Information Sharing: Place a strong emphasis on information sharing and data-driven partnerships amongst communities. Launch awareness campaigns targeting residents in high-risk neighbourhoods about theft prevention measures, such as smart surveillance systems.
Dashboard
Explore the Project
Read the full trend report on Medium or explore the code and data on GitHub.