Player Pass Map
Visualising every pass made by a player in a match — evaluating distribution, accuracy, range, and the zones of the pitch they target most frequently.
Overview
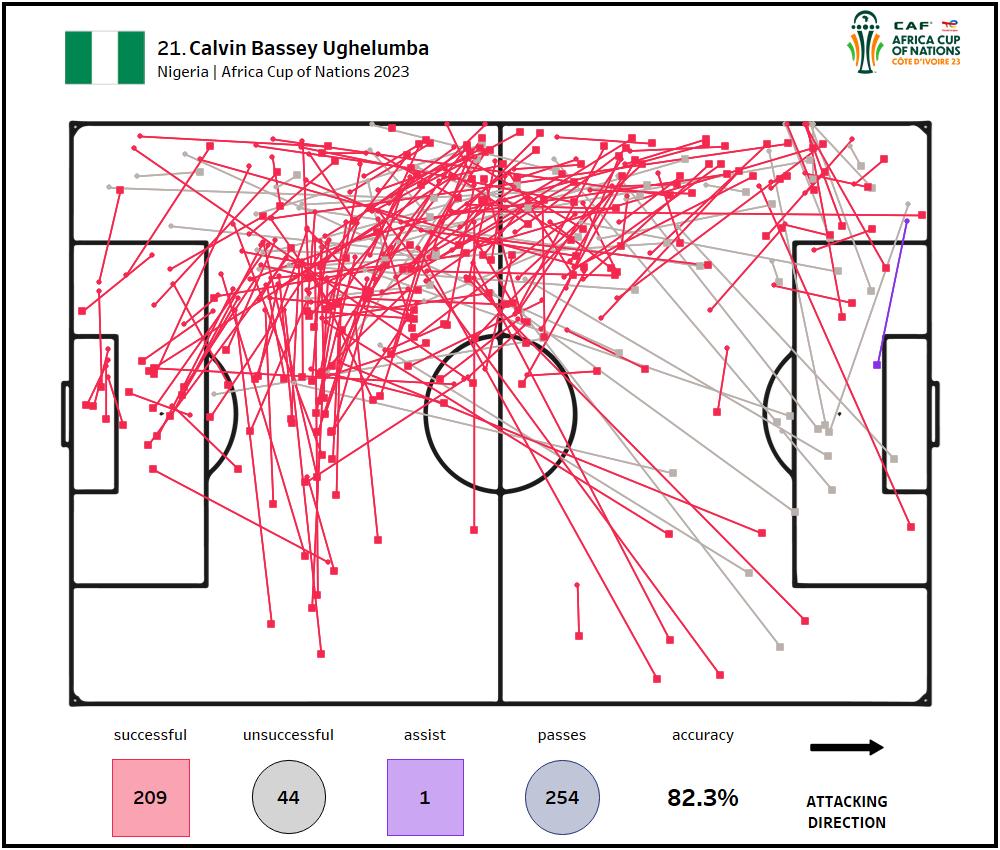
Individual player pass maps break down a footballer's entire passing output for a match in a single visualisation. Each pass is drawn as a line from its origin to its destination, colour-coded by success or failure — creating an immediate picture of where and how a player distributes the ball.
Built for Nigeria's AFCON campaign, this project plots the full passing profiles for selected players, enabling comparison across multiple matches or against positional peers.
What the Map Shows
- Distribution Range: Short, safe passes cluster close to the player's average position, while long-range balls extend to the far end of the pitch — revealing a player's preferred passing range and ambition in possession.
- Accuracy Patterns: Completed passes (typically green) vs. incomplete passes (red) highlight which pass directions or distances carry the highest risk for a given player.
- Preferred Zones: Heatmap overlays show which areas of the pitch a player targets most often — useful for identifying fullback delivery zones, central midfield range, or attacking-third creativity.
Explore the Project
View the interactive Tableau dashboard or browse the code on GitHub.