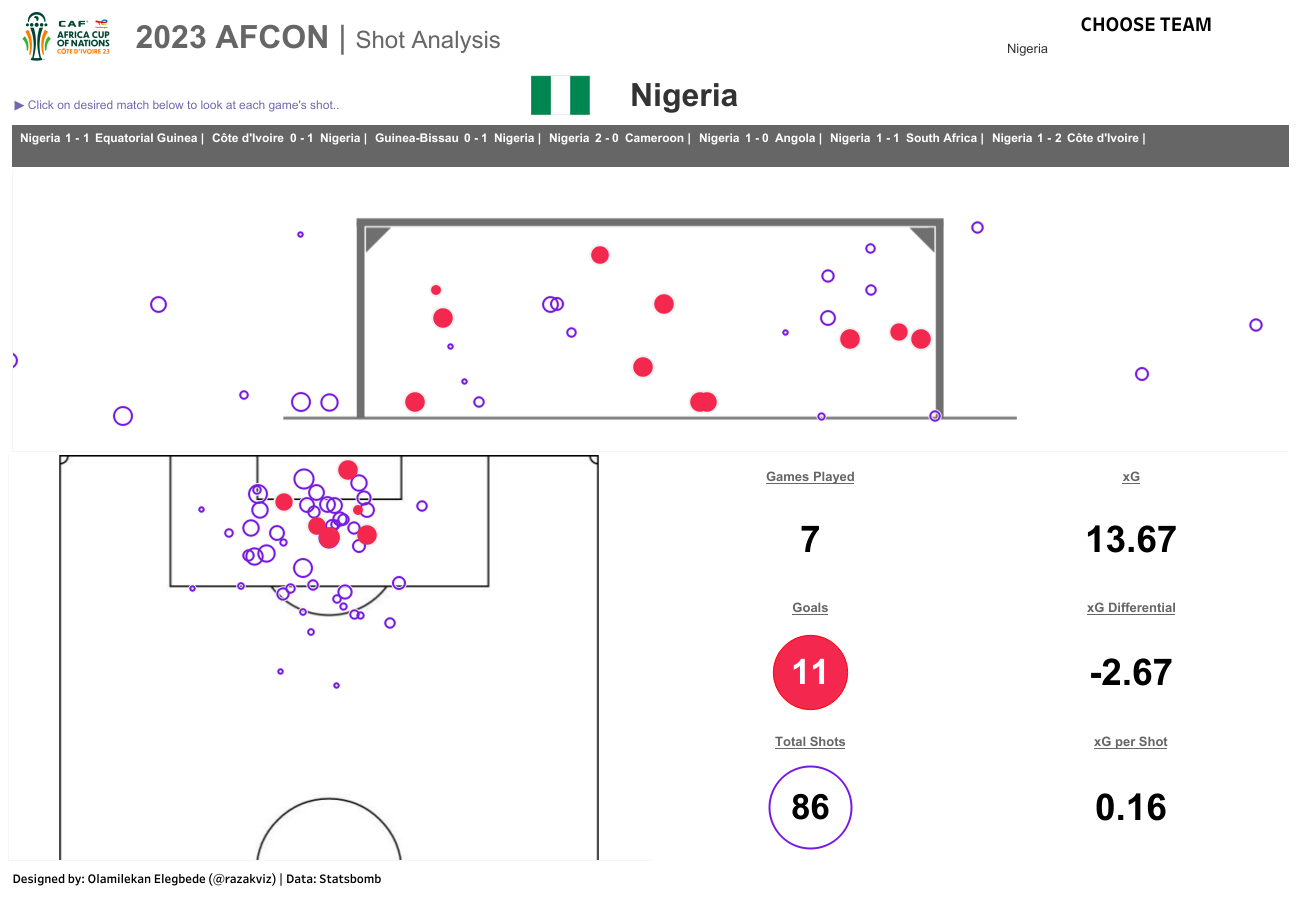
Team Shotmap
A team-level shot visualisation tracking all shot outcomes — goals, saves, and misses — with key advanced metrics including xG, xG differential, and xG per shot for a complete picture of attacking effectiveness.
Overview
A team shotmap aggregates all shot attempts across a match or tournament, combining location data with advanced metrics to give a complete read on a team's attacking output and finishing efficiency.
Built for AFCON using Statsbomb data, this project goes beyond a simple shot plot — incorporating xG, xG differential, and xG per shot to contextualise whether a team is creating high-quality chances and converting them at an expected rate.
Metrics Covered
- xG (Expected Goals): The cumulative quality of all chances created — providing a context-adjusted baseline for how many goals a team "should" have scored based on shot quality.
- xG Differential: Actual goals minus xG — positive values indicate a team is finishing above expectation (clinical); negative values suggest poor conversion or goalkeeper-dependent performance.
- xG per Shot: Average chance quality across all attempts — distinguishing teams that engineer high-value chances from those that accumulate volume through lower-quality efforts.
Explore the Project
View the interactive Tableau dashboard or browse the code on GitHub.